Tuesday, May 29, 2012

Roy Halladay Finally Breaks Down


            Given the information currently at our disposal, it appears that Roy Halladay is out with a lat strain for the next 6-8 weeks, leaving the Phillies in quite a precarious position.  While the team has won 5 of its last 6 and sits 2 games above .500 for the season, they are still in last place in the NL East, and the one loss was the game in which Halladay left early with the injury.  However, Phillies fans should realize how spoiled they’ve been for the past few seasons, and understand that the Halladay of 2011 is not likely to return, even after 8 weeks.

            First of all, let’s take into account that Halladay is 35 years old.  Last year, just 5 pitchers age 35 or older threw at least 200 innings, and 5 had an ERA of under 4.00 – Chris Carpenter, Tim Hudson, R.A. Dickey, and Hiroki Kuroda fit both bills.  From 2008 to 2011 (ages 31-34), Halladay averaged over 240 innings per season and had his four highest strikeout rate seasons, four of his seven lowest walk rate seasons, and four of his five lowest ERA seasons, so it’s safe to assume that without an injury, he would have done just fine.  But how good could we really expect him to be?

            Halladay has been nothing short of amazing since 2006, leading many to believe that he would be dominant for quite some time beyond this year.  From ages 29 to 34, no one except Greg Maddux accrued more Wins Above Replacement than Halladay in the modern era.  Names like Bob Gibson, Gaylord Perry, Jim Palmer, and Tom Seaver are the only ones above Halladay in both innings pitched and ERA over that age range.  He is sixth in wins by 29-34 year old pitchers, and his winning percentage is comparable only with Maddux, Randy Johnson, Pedro Martinez, and Whitey Ford (minimum 1000 IP).

            However, time takes its toll eventually.  Most pitchers begin to decline around age 35, and certainly injury becomes a concern before that.  Halladay has started between 31 and 33 games each of the past six years, an incredible run of health that seemed destined to end at some point.  And even if you grant him the benefit of the doubt that injury kept his statistics as “bad” as they were thus far this season, it really should be expected that he decline right about now.


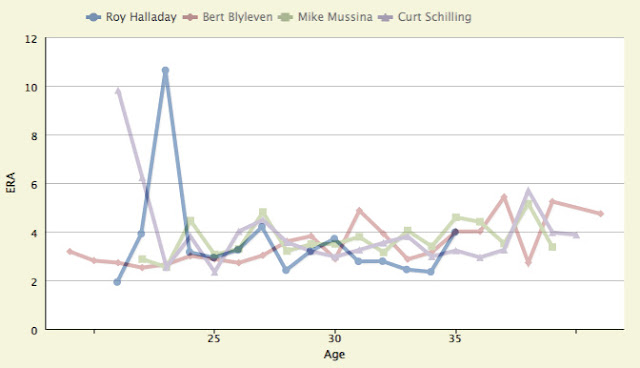
 From the above graph of four (soon to be Hall of Fame) pitchers’ ERA trends over their careers, you can see that their prime years (with the exception of Blyleven’s early career) lie right between ages 28 and 34.  However, after age 35, Blyleven, Mussina, and Schiling all declined and/or became quite inconsistent ERA-wise, and it appears likely that Halladay will do similarly.  While it is unreasonable to expect that his ERA will stay as high as it is (especially given that his K, BB, and HR statistics are quite similar to previous years in which he was just fine), I think that upon his return, Roy Halladay will not be the same pitcher Phillies fans have seen dominate the National League since 2010.  At 35, we really shouldn’t expect that of him.  

We should be expecting that of Cole Hamels.

Friday, May 25, 2012

Three True Outcomes: Clearing the Mechanism?


Bonus points if you get the “For Love of the Game” reference.

            In my previous two posts, I went over two of the more commonly referenced sabermetric statistics (BABIP and HR/FB) when it comes to assessing how lucky (or unlucky) a player has been over a small sample.  This “luck” may just involve the interaction between the ball and the bat or the field, but can also be related to the positioning of the fielders (as with BABIP).  In attempting to judge the “true” value of a pitcher or hitter, however, sabermetricians have tried their hardest to isolate those aspects of the game that involve just the pitcher and the batter, and nothing else (“clearing the mechanism,” if you will).  This leaves us with what most stat guys call the Three True Outcomes: strikeouts, free passes (walks / hit-by-pitches), and home runs.  These outcomes have formed the canon of Defense Independent Pitching Statistics (DIPS).  How well do these few statistics actually measure the “true” ability of a player?

            Obviously, there can be a bit of discussion as to whether or not these three outcomes are really “pure.”  Yes, it is clear that any at-bat that results in the ball being put into play introduces variance from the skill and positioning of the players in the field, and therefore only the set of outcomes {BB, HBP, K, HR} should be considered.  The rest of the outcomes should probably be considered through the lens of BABIP.  While this seems just fine when it comes to judging the skill of pitchers, it really is insufficient to judge the worth of a hitter. 

Take a look at the true-outcome stats, as well as other relevant numbers, of three marquee outfielders in 2011 (note that ISO represents Isolated Power, which is just Slugging Percentage minus Batting Average):


BB%
K%
HR
SB
AVG
BABIP
ISO
Nick Swisher
15.0
19.7
23
3
.260
.295
.188
Andrew McCutchen
13.1
18.6
23
23
.259
.291
.198
Carlos Beltran
11.9
14.7
22
4
.300
.324
.225

None of these players really separate from each other using the true outcome stats, but it becomes clear upon further inspection that Swisher is an inferior commodity, and it may be a matter of personal preference as to which of the remaining two you would want.  Why? 

            One thing that the True Outcomes ignore is speed.  While this has little to do with pure hitting ability, it certainly can make a player much more desirable and productive.  McCutchen stole 20 more bases than either of the other players.  While his batting average and on-base percentage were almost identical to Swisher’s, it can be assumed that his speed accounted for the slight advantage he held in isolated power, as he could leg out a couple more doubles and triples with that extra speed.

            As for Beltran, it is clear that, to some extent, his high BABIP contributed to a higher batting average than the other two (his career BABIP is right around .300).  However, it appears that he has an advantage over the other two players not in home-run power but in inside-the-park power, allowing him to gain a 20-point advantage in slugging without an advantage in the traditional power category, home runs.  Upon further inspection, Beltran hit the second-highest percentage of line drives in his career in 2011, producing a number of doubles and triples that he hadn’t produced in several years.  It becomes clear that you can still provide extra value by hitting the ball hard inside the park, even if you don’t hit more home runs than other players.

            While the true outcomes can form a pretty comprehensive representation of a pitcher’s performance (and I’ll get into this more later this week), it seems like a few other factors need to be considered with hitters.  A player’s speed contributes to his batting average (through BABIP), stolen base totals, and slugging percentage, and thus should not be taken lightly when considering performance.  Also, there is a good bit of variability of performance that can be found between players that have the same home run total, as players who can add a good amount of doubles and triples are much more valuable and likely to have consistent success over the course of a season or career.

Tuesday, May 22, 2012

Swing, and a Long Drive!


            My post a couple days ago talked briefly about the major differences in the direction and distance of the ball’s flight that can come from a small change in where on the bat the ball is hit.  No statistic captures this concept more than the percentage of fly balls that become home runs (HR/FB% -- yes it’s an awkward name).  I’m going to help describe this using simple geometry, because I don’t feel like dealing with the physics of it, and I’m sure you don’t feel like reading about it.

            Take a fly ball that reaches a peak of 150 feet and travels 300 feet (this is obviously just a rough number used to make the calculations easier, but go with it).   To save you the time reading (and the time criticizing my calculations), a change in 1/10th of an inch in the position of the ball on the bat (and thus a reduction in the angle of flight by just 2 degrees) causes the ball to fly 10 feet further.  In short, there can be pretty strong deviations in the way the ball flies resulting from small, possibly uncontrollable changes in the way that the ball hits the bat.

            Therefore, to some extent there is a good bit of variability in the distance a ball will travel (or the height it will fly) that is not so strictly under the control of the hitter.  HR/FB% captures a bit of that randomness.  The average percentage of fly balls that become home runs is just under 10%, with a likely range of 0-30.  Batters with different styles tend to have different career average HR/FB%, just like with BABIP.  For example, Ryan Howard’s career average is 28.7%, while Juan Pierre’s is 1.2%.

            However, variance over the course of a career can produce pretty large shifts in power numbers, which contribute to a player’s RBI, HR, and R totals, as well as his batting average (fly balls are incredibly likely to be outs if they are not home runs).  Since Howard’s first full season in 2006, his best-to-worst HR/FB% per season has ranked like so: 2006, 2008, 2007, 2009, 2011, 2010.  His home-run totals in those seasons rank like so: 2006, 2008, 2007, 2009, 2011, 2010.  Notice a correlation?  In 2009, Joe Mauer hit 28 home runs after hitting 29 in the previous three seasons combined.  One needs to look no further than his HR/FB% of 20.4%, which was a full 10% higher than any other season he has posted before or since. 

            In a similar way to BABIP, HR/FB% is a better estimator of randomness with pitchers than with hitters because the variability in the statistic due to a batter’s skill set should even out over the course of a pitcher’s season.  Roy Halladay shouldn’t face a significant amount more sluggers or slap hitters than other pitchers in the league (or than himself in previous years) over the course of a full season, so large changes from year to year can be at least partially attributed to luck.  Or, you know, throwing beach balls up there.

            Take Ubaldo Jimenez’s breakout 2010, for example.  Without significant changes in his other underlying statistics (strikeout and walk rates, BABIP, etc.), his HR/FB% was extremely low at 5.1%, and he posted an ERA a full run below his career average.  Not only that, but his 9.3% and 10.5% HR/FB% in the next two years represent more average outcomes, and he has posted an ERA above 4.80 since the start of last season. 

With home run rates in mind, here are some players I expect to start to decline:

HITTERS: Matt Kemp (41.4%), Josh Hamilton (40%), Bryan LaHair (33.3%)
PITCHERS: Brandon Beachy (1.7%), Gio Gonzalez (2.6%), Ted Lilly (3.9%)

Here are some players I expect to improve when it comes to home run rates:

HITTERS: Jimmy Rollins (2.0%), Alex Rios (2.2%), Jeff Francoeur (2.6%)
PITCHERS: Ervin Santana (23.1%), Adam Wainwright (21.9%), Jonathan Niese (21.1%)

Saturday, May 19, 2012

Hit 'Em Where They Ain't


            My introductory post on the topic of luck/randomness (or stochasticity -- Ivy League education right there) in baseball focused a lot on the degree to which small changes in the positioning of the bat and the ball can produce large differences in result.  Not only that, but slight changes in the positioning or movement of the fielders (like A-Rod giving one too many winks to the blonde in the third row) can also make the difference between an out and a single.  The most basic tool that we can use to assess how these random events have affected a hitter’s performance is Batting Average on Balls in Play (BABIP).
           
            BABIP, unsurprisingly, measures a player’s batting average on those at-bats in which he puts the ball in play (i.e. NOT a walk, strikeout, hit-by-pitch, or home run), putting the outcome of the at-bat up to the positioning of the fielders relative to the ball.  Each player’s skill set contributes to where his BABIP will tend to fall, as faster players beat out more grounders and thus have a higher BABIP, while sluggers tend to be slower and hit more home runs, reducing their average BABIP.  Over the course of a single player’s career, however, there can be pretty strong variability in the stat due to the positioning of fielders when he is at bat, as well as simple luck.
           
            Here’s an example of the effect that BABIP can have on performance from year to year.  Take Ichiro Suzuki, a guy who has been around as long as he has because of his ability to get a lot of hits with his speed.  His average BABIP over his career has been .350, which is about 50 points above the league average in that span.  To make this a more appropriate discussion, I’ll disregard the past two seasons, in which his age has caught up to him and his batting average dropped 50 points from his career average.  From his rookie year in 2001 to 2010, Ichiro’s worst BABIP was .316, and his best was .399, representing pretty large deviations from his career numbers.  These seasons also correspond to his worst and best batting-average seasons, at .303 and .372, respectively.  In fact, the r2 value between Ichiro’s BABIP and batting average, or the percentage of variance in batting average that can be explained by BABIP, is 97%, meaning that almost all of Ichiro’s year-to-year changes in batting average can be explained by the weird stuff that happens once the ball hits the bat.

            How can we use BABIP to our advantage?  Let’s take my fantasy team, for example.  The only reason I drafted Tigers catcher Alex Avila this season was because he represented a great value, but I wasn’t happy about it.  Why?  He hit .295 with 19 homers and 82 RBI while only playing 140 games because Victor Martinez played some catcher.  This season, Martinez is hurt and they add Prince Fielder – slam dunk, right?  I was skeptical.  Avila’s BABIP in 2011 was .366, 90 points above what he posted in 2010, his only long stay in the majors.  Regression to the mean would probably put Avila’s BABIP at more like .310, cutting his batting average by a solid 50 points, and thus bringing his run and RBI totals down as well.  What has actually happened?  He’s on pace to hit .225, 19 homers, and 56 RBI this season, a significant downgrade from a breakout 2011.


            I would be remiss not to mention that BABIP can be just as useful for pitchers as for hitters.  While skill set doesn’t really come into play with pitcher BABIP (most players’ career rates center around .290 to .310), the concepts of luck and fielder ability still apply, and perhaps more consistently than with hitters.  For example, there was controversy as to whether Rays pitcher Jeremy Hellickson’s 2.95 ERA in 2011 could be maintained given the .223 BABIP against him.  However, if you look deeper, his low BABIP is as much about the Rays’ team fielding prowess as it is about good fortune.  Among Rays pitchers with at least 40 IP, no one had an opponents’ BABIP higher than .284.
           
            Cubs ace Ryan Dempster had a 4.80 ERA last season, but had one of the highest starters’ BABIP in 2011 at .324.  This season, his BABIP is .259, and his ERA is 1.74.  Former A’s starter Trevor Cahill posted a 2.97 ERA and went 18-8 in 2010 with a shockingly low .236 BABIP.  In 2011, his BABIP went back to normal (.302), and he went 12-14 with a 4.16 ERA.  Granted, there are other factors at play here, but absent a dramatic change in the defense behind him or the park in which he plays, a pitcher’s performance is very much dependent on where the ball happens to fall.


Based solely on BABIP, here are some players that are overachieving that I might expect to fall back to earth relatively soon (with their BABIP and batting average or ERA, as of last night):

HITTERS: David Wright (.470, .411), Bryan LaHair (.406, .330), Paul Konerko (.406, .362)
PITCHERS: Ted Lilly (.196, 2.11), Brandon Beachy (.214, 1.33), Lance Lynn (.219, 1.81)

As for players who one might expect to bounce back from a tough start…

HITTERS: Eric Hosmer (.165, .174), Jose Bautista (.178, .207), Russell Martin (.186, .167)
PITCHERS: Max Scherzer (.403, 6.26), Josh Johnson (.385, 5.36), Ivan Nova (.380, 5.44)

Friday, May 18, 2012

Luck Be A Lady Tonight


            So, after a several month hiatus, and I'm sure much to your chagrin, I'm back.  I hope you’ll pardon my prolonged absence in a much more gracious way than I will handle the eventual returns of Ryan Howard and Chase Utley to the Phillies lineup, but such is life.  Things get in the way, Achilles’ tendons tear, we all move on.  I’m endeavoring to slightly reformat the way I do this blog, still writing about my two favorite sports (baseball and football) but doing so in such a way that I part the veil somewhat on the different statistical approaches to the game.  In this way, I hope to give people who are otherwise unwilling to deal with all of the statistical mumbo-jumbo a little better understanding of why people are so immersed in these types of analysis.  I know I’m a bit late on the whole baseball thing at this point, but having just one month’s stats can actually help crystallize my point.

            Despite similar claims from football-centric television networks (just because you’re not NFL-sponsored doesn’t mean that doesn’t include you, ESPN), baseball really is the game of inches.  The result of the interaction between a quickly spinning spherical ball and a swinging rounded bat can change dramatically if even the slightest adjustment is made in the approach angle of either of those objects.  Ever hear announcers talk about a foul ball back to the screen as a case in which the batter “just missed it?”  If the bat were just an inch higher in the zone, that might have gone straight out to center field for a home run.  An inconsistency in the terrain of the infield could cause a ground ball to roll slightly differently, allowing it to evade the outstretched glove of an infielder.  These inconsistencies, combined with the fact that the players are running around and flailing their arms with some degree of uncontrollability, make the task of describing statistically a player’s true ability or performance a difficult one.

            In the past few decades, baseball statisticians have endeavored to factor these incredibly dynamic factors out of their analyses.  Over time, one would expect the strange bounces or muscle twitches to balance each other out when it comes to in-game results, being equally beneficial and harmful across a large enough sample.  Per the statistical axiom of regression to the mean, any result that strongly deviates from expectation is merely a result of sample variance (or luck, if you’d like).  No one expects a coin to come up heads 80 times out of 100, but they might accept 8 out of 10 as plausible.  For example, consider those little dribbling “seeing-eye” singles that just eke their way through the middle of the shortstop and third baseman, or the broken-bat bloopers that just drop in front of the right fielder and behind the second baseman.  The vast majority of the time, if a batter hits a pitch that softly, a fielder will be able to get a glove on it and retire him easily, but in some cases it works out for the hitter.  Additionally, consider the large deviations in the angle that a ball is hit that result from a small difference in the timing of the swing.  If a hitter swings a fraction of a second earlier or drops the bat a fraction of an inch, the trajectory of the ball could change just enough to turn a double in the gap into a line-out, or a home-run into an innocuous fly ball.

            While many of these types of “random” results balance themselves out in terms of whether or not they benefit the player in question, over the course of a small enough sample size (and this could theoretically be as long as a season in some cases), a player can certainly flip 10 heads in a row.  Identifying which players are having more or fewer balls bounce their way can help us understand why a career .270 hitter like Evan Longoria hits .240 for a season, or why Zack Greinke allowed about 1 run per 9 innings more than he really should have.  If used correctly by general managers (or fantasy baseball managers), these tools can help identify players that seem to be on the decline but are just experiencing natural variance and acquire them cheaply.  Or, perhaps, they can just give a former college student something innocuous to obsess about.

            In the next few posts, I'll introduce all the baseball metrics that I've been using for the past couple of years to really help me understand the ebbs and flows of a baseball season.  The primary purpose of many of these will be to separate luck from skill, while some of them will just aim to effectively compare the performances of players, regardless of external circumstances.  The secondary purpose, we will likely discover, is to make half the population fall asleep.  Sweet dreams.